Track Your Energy Efficiency Projects in Energy Charts
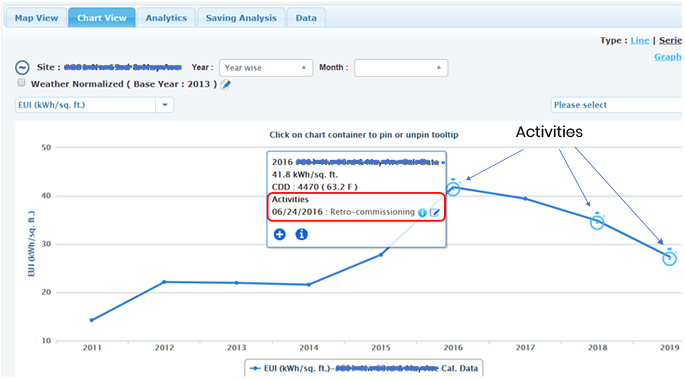
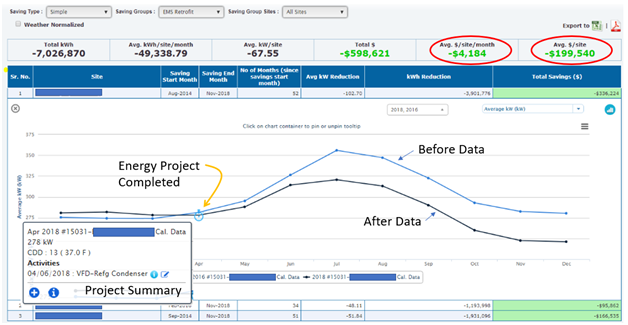
kWh360 Energy Efficiency Management Software Suite, a product from Singh360 Inc., now allows users a unique way to track any activity or any project at any site. When generating an Energy Use Index graph over time, or any other graph, these activities are integrated in the graph so you can see why the energy spend may have gone up or down.
These innovations help organizations set priorities for efficiency projects based on sustainability goals, speed of payback, and the measured return on investment. Contact Singh360 to see if these innovations fit with your facility and energy management strategy going forward.